The United States Department of Agriculture's Economic Research Service has released the latest data on agricultural trade for various commodities, including wheat, corn, barley, sorghum, rice, soybeans, soybean cake and meal, soybean oil, and cotton. Here are the key highlights from the reports:
Wheat
- Net sales of 667,200 metric tons (MT) for 2024/2025 were primarily for unknown destinations (148,000 MT), the Philippines (102,000 MT), Mexico (86,800 MT, including decreases of 16,000 MT), Japan (71,500 MT), and Thailand (55,900 MT), with reductions for Trinidad and Tobago (1,000 MT).
- Exports of 323,100 MT were primarily to Mexico (99,000 MT), Japan (73,100 MT), Brazil (65,500 MT), Chile (55,000 MT), and Honduras (11,600 MT).
Corn
- Net sales of 542,200 MT for 2023/2024 were up 6 percent from the previous week, with increases primarily for Mexico, Japan, Colombia, Taiwan, and Malaysia, but these were offset by reductions for unknown destinations and the Philippines.
- Exports of 1,177,200 MT were primarily to Mexico, Japan, Colombia, South Korea, and China.
Barley
- No net sales were reported for the week, and exports of 300 MT were to Japan and South Korea.
Sorghum
- Net sales of 3,200 MT for 2023/2024 were down 94 percent from the previous week, with increases reported for China, offset by reductions for Mexico. No exports were reported for the week.
Rice
- Net sales of 17,100 MT for 2023/2024 were down 80 percent from the previous week, with increases primarily for Japan, Mexico, Saudi Arabia, Canada, and Panama, offset by reductions for Venezuela.
- Total net sales of 5,000 MT for 2024/2025 were for Honduras, and exports of 70,800 MT were primarily to Panama, Haiti, Japan, Venezuela, and Mexico.
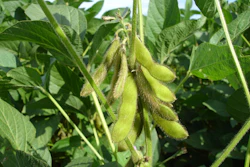
Soybeans
- Net sales of 282,900 MT for 2023/2024 were down 49 percent from the previous week, with increases primarily for China, the Netherlands, Germany, Mexico, and Malaysia.
- Exports of 391,900 MT were primarily to Egypt, Mexico, the Netherlands, Germany, and Japan.
Soybean Cake and Meal
- Net sales of 219,300 MT for 2023/2024 were up 23 percent from the previous week, with increases primarily for the Philippines, Honduras, Costa Rica, Ecuador, and Morocco, offset by reductions for unknown destinations, Japan, Belgium, and Guatemala.
- Exports of 237,800 MT were primarily to the Philippines, Honduras, Ecuador, Canada, and Guatemala.
Soybean Oil
- Net sales reductions of 10,600 MT for 2023/2024 were reported, mainly for Canada, more than offset by reductions for Mexico.
- Exports of 5,100 MT were primarily to Mexico and Canada.
Cotton
- Net sales of Upland totaling 90,600 RB for 2023/2024 were down 52 percent from the previous week, with increases primarily for China, Pakistan, Vietnam, India, and Indonesia, offset by reductions for Turkey.
- Exports of 141,000 RB were primarily to China, Pakistan, Turkey, Vietnam, and Mexico.
The USDA ERS data provides valuable insights into the agricultural trade landscape, reflecting the dynamics of sales and exports for various commodities. These reports offer a comprehensive overview of the current trends and patterns in global agricultural trade, which can be crucial for stakeholders in the agricultural industry and beyond.