Agricultural and food production (including in the grain and feed segment) is a complex, adaptive set of processes involving hundreds of decisions per crop season. In this rapidly changing world of climate change, supply chain disruptions, political unrest and shrinking margins, the way those decisions are made must adapt accordingly.
This adaptation involves using data in situations that might have been previously solved using customs or what worked in the past, with decisions ranging from planting dates to acceptable harvest moisture content, to preferred feed ingredients. Data-driven decision-making has multiple stages:
- Identifying what data must be collected to drive the decision,
- Defining how the decision must be made using those inputs,
- Planning how to operationalize the decision; i.e, make the decided outcome happen, and
- Making sure all the parts of this data-driven decision-making process happen in a timely manner.
You can’t manage what you can’t measure (and there’s a lot to manage)
A particular family of data especially important to drive decision-making in the feed and grain industy is observations and measurements, where some small part of the world (a load of grain on a truck, a grain sample, the contents of a grain bin) called the feature of interest has one or more observable properties (weight, temperature, protein content, the concentration of a particular pathogen, etc.) that we wish to obtain some kind of result for. When that result is numeric (e.g., 12% protein content) the observation is called a measurement. Several important examples of observations and measurements in grain and feed follow, along with some practical difficulties that arise with their use:
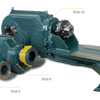
- Weights: Weighing inbound and outbound grain and feed loads involves electronic scales. Different manufacturers may use different formats for making scale data available.
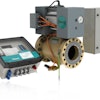
- Grain moisture content: Proper moisture levels are critical to prevent mold growth and spoilage. Managing moisture often involves expensive drying or blending grain from different sources. Moisture is measured at different points along the lifecycle of a grain or feed product. Different observation methods can produce different results, and the calibration history of the instrument will also affect the quality of the result.
- Temperature: This variable is also measured in many places along the lifecycle of the grain or feed product (e.g., overheating during drying and processing can reduce the nutritional quality of grains). Keeping track of what a particular measurement means (e.g., dryer entry vs. exit temperature) can be hard to do, which can introduce data quality problems, and reduce the fitness for decision-making use of the dataset accordingly.
- Mycotoxin contamination: Toxic metabolites from fungi that grow on crops in the field or during storage can cause disease and death in humans and livestock. Mycotoxin concentrations are measured in a laboratory, and results may vary based on the analytical method used. Communicating these results to where they can drive decisions quickly and accurately, with the metadata necessary, is very challenging when the lab returns data as a PDF or printout; electronic versions such as the Modus lab data format bring promise of change, but must be adopted and implemented broadly to make a difference.
- Pesticide residues: The most recent pesticide residue monitoring report from the US Food and Drug Administration (FDA) showed that about 64% of US grains sampled and 46% of imported grains had pesticide residues. While most of these results were under the maximum allowable residue levels (all of the US samples, and all but 9% of the imports), consumer concerns about the topic are high, and can influence purchasing decisions. Pesticide residues are also measured in laboratories, but these tests can be very expensive and subject to the same preservation of meaning (i.e., semantic) challenges aforementioned.
- Nutrient Variability: Variability in nutrient content, including proteins, vitamins, and minerals, can affect the nutritional value of grains, their usability for different purposes, and therefore their market price. This issue is often influenced by environmental factors, farming practices, and grain storage conditions. Field equipment can estimate some of the observed properties of interest, but their accuracy is dependent on calibration and the incorporation of calibration results into the results returned. Nutrient content can of course also be tested in the lab, often returning different results than field equipment.
This list above is long, yet all of the observations and measurements it describes fit the same model: They involve features of interest, observed properties, observation methods and so forth. They also often fall short of their potential to drive valuable, timely decisions due to a lack of interoperability. The systems and equipment that produce the data often use proprietary formats or interfaces that are not compatible with the equipment or software system that will use the data. Not only that, but different systems also use their own proprietary vocabularies or lists of codes to represent the data. This introduces much additional friction and difficulty in data exchange.
The way to tackle interoperability and data quality problems is through standards: widely agreed-upon recipes for how to do things; in our case, for encoding data so it can be easily exchanged and understood without uncertainty. In 2021 the International Organization for Standardization (ISO) realizing that a lack of data data interoperability in the agrifood industry was getting in the way of sustainable development (Again, you can’t manage what you can’t measure!) created a Strategic Advisory Group for Smart Farming (SAG-SF), with the mandate to:
- Survey existing data standards within ISO that are applicable to data-driven decision-making in agrifood systems
- Find gaps in those standards
- Propose a strategy that ISO could follow moving forward
The SAG-SF final report featured 49 recommendations, including creating a permanent home for international standards for data-driven agrifood systems (which now exists, and is called the ISO Technical Committee 347, Data-driven agrifood systems), and creating what is known as a reference architecture for the domain — a kind of high-level blueprint or set of best practices to use when designing a software system, to help make it interoperable and enable high-quality data.
Work on the reference architecture will begin on July 9, 2024, with the first of several monthly international workshops, collectively called ISO/IWA 47, that anyone can join. Follow this link to learn more about the workshop, where your skills fit into the picture, and how to participate.
Why is this important? Involvement from different stakeholders is critical for these efforts to truly make a difference. The only way to ensure that standards help make things “talk to one another” in the industry, so we can better manage our systems and create more value for our customers, is to show up and be seated at the table. We have an opportunity to do this now, which has been a long time in the making.
R. Andres Ferreyra, Ph.D., is industry data standards and collaborations lead for Syngenta. His role currently focuses on managing and facilitating pre-competitive standards development processes in the industry, primarily as chair of the ISO Technical Committee 347 on data-driven agrifood systems, and chair of ISO’s IWA 47 on a reference architecture for data-driven agrifood systems. He may be contacted at [email protected].